

Investigating the Census Data
The first page in this section carries the data recorded when the census was taken in Cromer in 1841. The tools on the page enable you to analyse that data and draw conclusions from it.
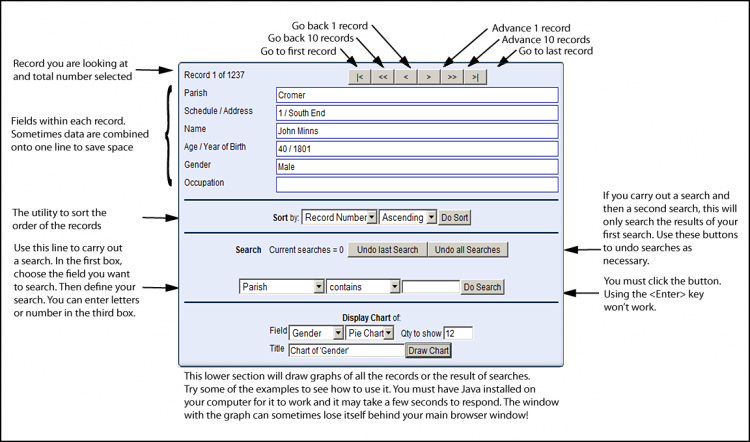
This diagram below will help you understand how you can carry out analysis by searching, sorting and drawing graphs using the data.
Think of the data set as being 1237 records cards, one for each person in the town on the day of the census. Well, that's not quite right as you'll find sometimes the census officer found an empty house and he had to record that as well. There's another page in this section with more background about the censuses taken in the 19th century.
Have a look through the diagram then try some of the examples further down the page.
What were the occupations of people in the town?
Go to the lower box, click on the arrow of the drop-down menu of the 'Field' and choose occupation. Leave all the other boxes and just click 'Draw Chart'.
You'll have a 'Pie Chart' which can tell us quite a lot!
The first thing it tells us is that it wasn't considered worthwhile recording what a large part of the population did! You could carry out a search to find out more about that section but you can probably guess the limitations of the data - in respect of males and females.
It might be helpful to just graph those for whom an occupation is recorded. Let's search before graphing this time.
Go to the 'Search' box. Choose 'Occupation in the left hand side drop-down menu. Choose 'is not empty' in the next box. Click on the 'Do search' button.
How many records do you have? These are only the records with data on the persons occupation.
In the 'Display Chart' box, choose the Field as 'Occupation, the graph as 'Pie Chart' and change the next box from 12 to 20. What is the most common means of making a living? Are there any occupations that don't continue today?